
Published 31 July 2026 · Latest rate 16.64 on 30 Jul · Last complete week 16.54 · Fair value 16.72
Where the rand stands
The rand last traded at 16.64 on 30 July. The Digest works on averages rather than daily closes, so its figures are anchored on the last complete week — 20 to 24 July — which averaged 16.54.
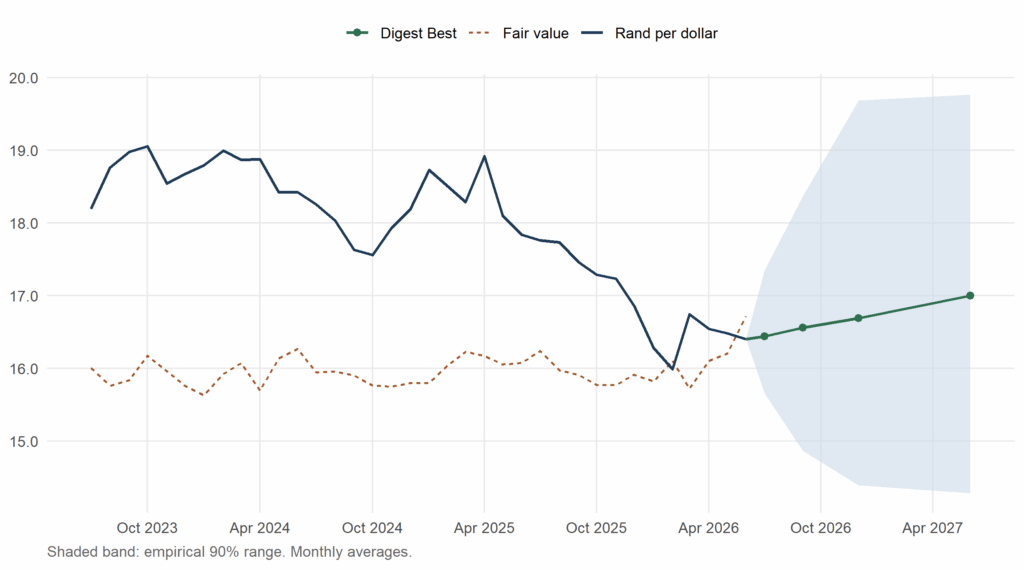
Over June the rand averaged 16.40, and our fair-value model — a long-run relationship between the exchange rate and relative prices, money, activity and interest rates — puts equilibrium for that month at 16.72.
That leaves the rand -1.9% away from fair value: essentially at equilibrium.
| Against fair value | Rand per dollar |
|---|---|
| +10% | 18.47 |
| +5% | 17.57 |
| +2% | 17.05 |
| fair value | 16.72 |
| the rand now (-1.9%) | 16.40 |
| -2% | 16.39 |
| -5% | 15.90 |
| -10% | 15.13 |
A gap this small is well inside the model’s normal scatter (one standard deviation is about 13%), so it is not a trading signal — it says the rand is broadly where the fundamentals put it.
The forecast
Weekly
| Horizon | Week ending | Forecast | 90% range |
|---|---|---|---|
| 1 week (nowcast) | 31 Jul 2026 | 16.56 | 16.11 – 17.04 |
| 2 weeks | 07 Aug 2026 | 16.56 | 15.91 – 17.33 |
| 3 weeks | 14 Aug 2026 | 16.54 | 15.73 – 17.49 |
| 4 weeks | 21 Aug 2026 | 16.55 | 15.63 – 17.64 |
Monthly
| Horizon | Month | Forecast | 90% range |
|---|---|---|---|
| 1 month (nowcast) | July 2026 | 16.44 | 15.66 – 17.35 |
| 3 months | September 2026 | 16.56 | 14.86 – 18.37 |
| 6 months | December 2026 | 16.69 | 14.39 – 19.68 |
| 12 months | June 2027 | 17.00 | 14.28 – 19.77 |
A horizon marked nowcast is a period already under way — part of it is observed, so it is an estimate of a partly-known average rather than a forecast of an unknown one.
The ranges are empirical: they come from how far this combination’s forecasts have actually missed in the past, at that horizon, not from a model’s own assumption about its errors.
The picture
What is moving it
Fair value is not a mood; it is an arithmetic consequence of four things. Because the model is linear, we can split the past year’s move in fair value into exactly what each driver contributed.
| Driver | Moved by | Pushed fair value |
|---|---|---|
| SA vs US inflation | +1.5% | +2.9% |
| SA vs US money supply | +3.5% | -1.9% |
| SA vs US output | -4.7% | +2.0% |
| Interest rate gap | +0.45 pp | +0.9% |
| Net | +3.9% |
The spread across the suite is itself informative — when the models disagree, the outlook is genuinely uncertain rather than merely uncertain-sounding.
| Horizon | Lowest | Highest | Spread |
|---|---|---|---|
| 1 month | 16.40 | 16.72 | 1.9% |
| 3 months | 16.40 | 16.72 | 1.9% |
| 6 months | 16.40 | 16.86 | 2.8% |
| 12 months | 16.40 | 17.33 | 5.7% |
How the models have been doing
We publish the scoreboard whether or not it flatters us. The benchmark is the random walk — the assumption that tomorrow’s rate is today’s. Beating it consistently is famously hard, and mostly we do not.
| Model | 1 mth | 3 mth | 6 mth | 12 mth |
|---|---|---|---|---|
| Random walk (benchmark) | 1.00 | 1.00 | 1.00 | 1.00 |
| ARIMA | 0.99 | 1.00 | 0.99 | 1.02 |
| Exponential smoothing | 0.99 | 1.05 | 1.10 | 1.12 |
| Local trend | 1.01 | 1.02 | 1.01 | 1.06 |
| Fundamentals (error-correction) | 1.00 | 1.03 | 1.03 | 1.01 |
| Fundamentals (system) | 2.57 | 1.58 | 1.37 | 1.21 |
| Fair value | 4.13 | 2.29 | 1.76 | 1.37 |
Two honest points about that table. Most of the suite sits at or just above 1.00, which is what the exchange-rate literature has found since Meese and Rogoff in 1983. And our combined forecast is not reliably better than the single best model — its value is that you do not have to know in advance which model that will be.
Where the suite does earn its keep is the fair-value gauge above: not as a prediction of next week, but as a statement about whether the currency is expensive or cheap against its fundamentals.
Method and data
| Series | Latest month |
|---|---|
| SA consumer prices | Jun 2026 |
| SA money supply (M3) | Jun 2026 |
| SA manufacturing output | May 2026 |
| SA mining output | Apr 2026 |
| US consumer prices | Jun 2026 |
| US money supply (M2) | Jun 2026 |
| US industrial production | Jun 2026 |
Exchange rate data from SARB via EconData; US series from FRED. The target is the average rate over the period, not a closing snapshot. Models are estimated on logs and forecasts reported in levels. Fair value is a long-run cointegrating relationship estimated from 2002. Forecast ranges are empirical quantiles of past out-of-sample errors.
Rand Dollar Digest · produced 31 July 2026 · exchange rates to 30 Jul 2026 · forecast origin: week ending 24 Jul 2026, the last complete week · fundamentals to Jun 2026