The time series, trends and turning points
A business cycle is an example of a time series because it measures changes in certain factors (called variables) over time. Numerical data is collected at regular intervals to measure certain economic indicators. Time is the independent variable because it changes independently and is not dependent on other factors to change. The dependent variables are the indicators of changes in economic activity, for example real GDP.
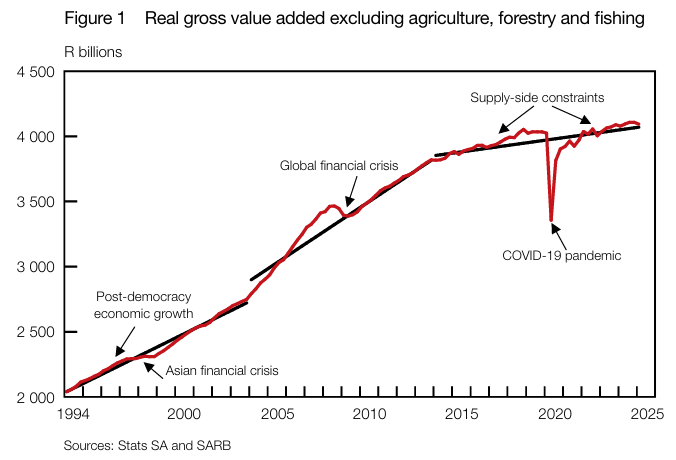
The trend is the long-term movement or pattern on the graph. The cycles are the fluctuations around the trend line and they show the increase and decrease in economic activity over a shorter period.
The two turning points are the peak and the trough.
- The peak occurs when economic activities are at their greatest. It is the end of the upswing phase.
- The trough occurs when economic activities are at their lowest. It is the end of the downswing phase.
In the real world, figuring out the peaks and troughs of the business cycle and pinning them down to a specific quarter is a complicated empirical exercise. In a recent research note, the Reserve Bank explains its method for the period 2020 to 2025.
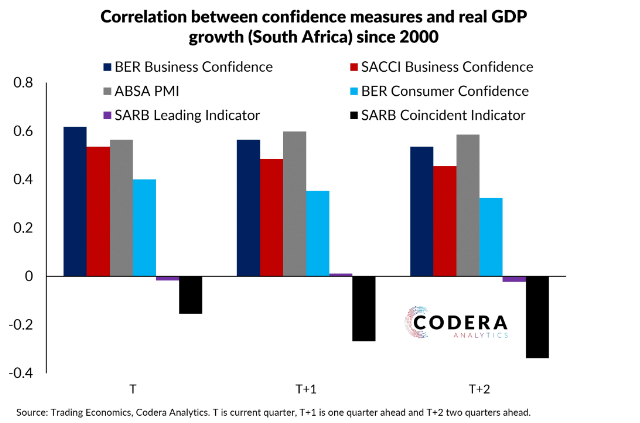
A recent Codera post shows that it is difficult to use these indicators to predict what will happen with GDP growth. Confidence indicators are correlated with GDP growth outcomes in South Africa, although SARB’s coincident and leading indicators are not. They also consider Business and Consumer Confidence indicators, and a Purchasing Manager’s Index.
Another indicator worth mentioning is BankServAfrica’s banking activity index (BETI), as it is available with a short lead time, making it a potentially useful source of information for nowcasting GDP.